
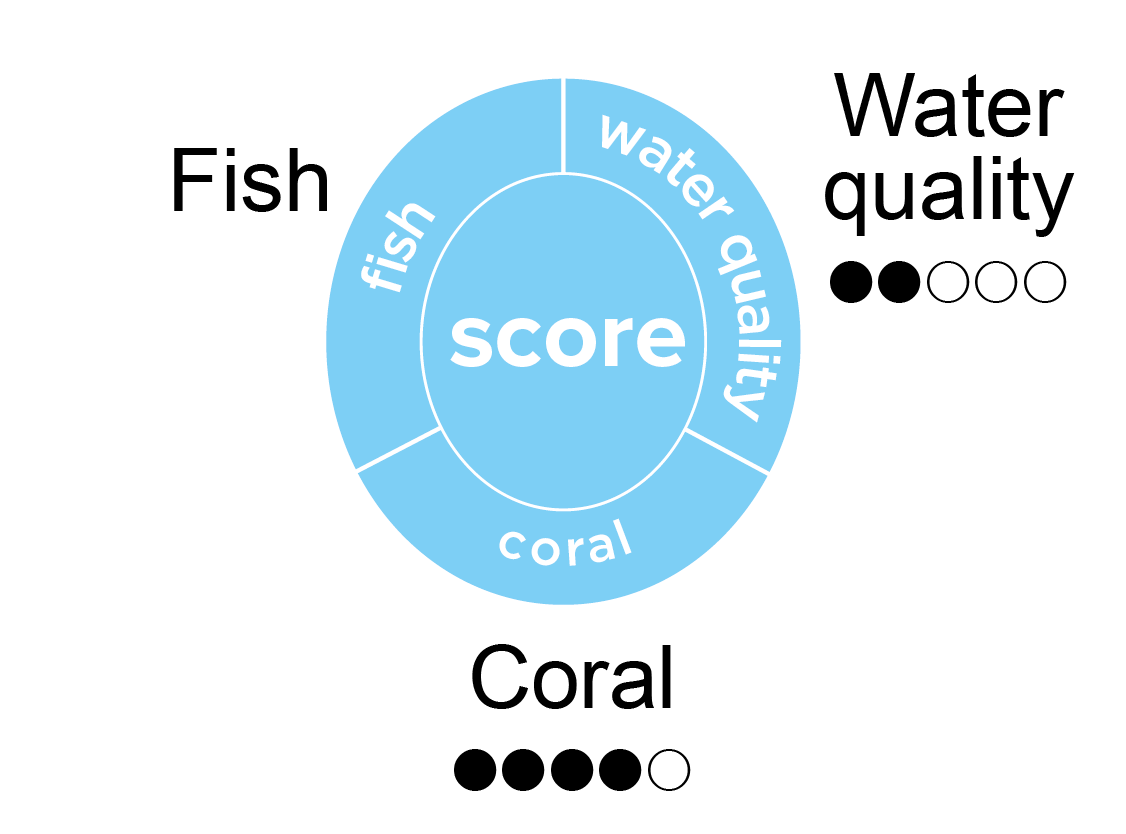
very good

good

moderate

poor

very poor

insufficient data

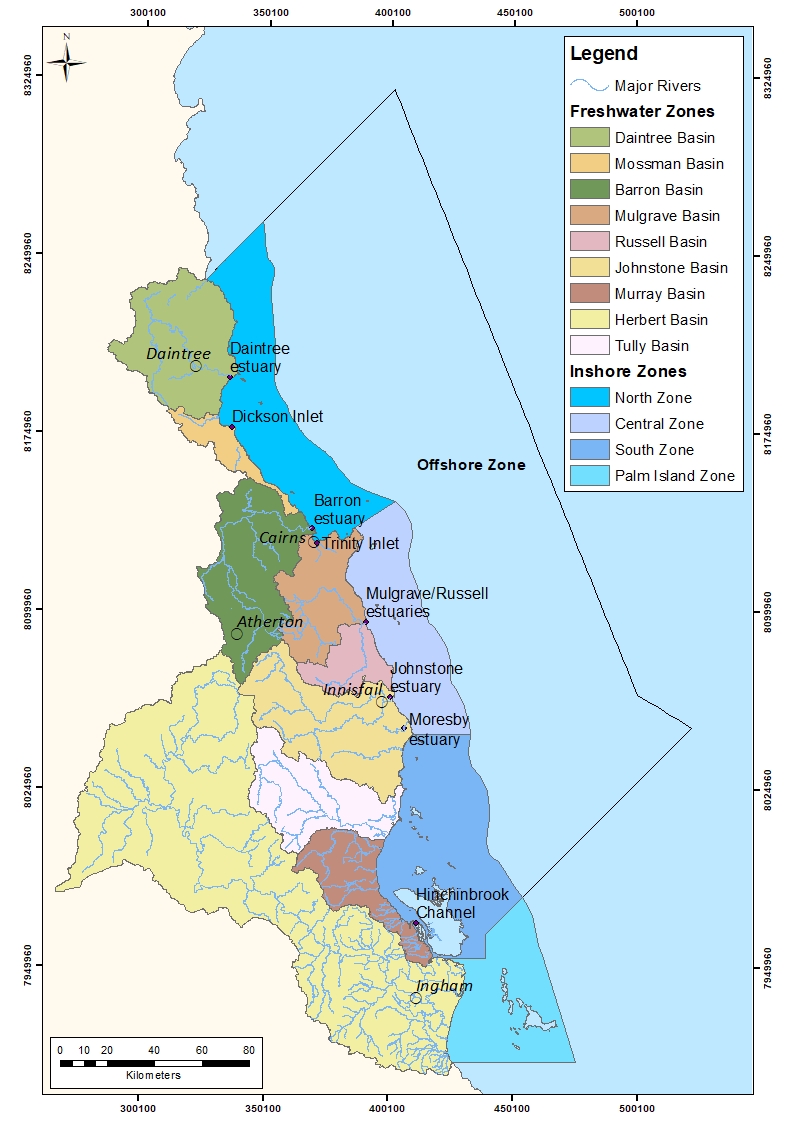
Freshwater
indicators and confidence

Estuarine
indicators and confidence

Inshore marine
indicators and confidence

Offshore marine
indicators and confidence


very good
good
moderate
poor
very poor
insufficient data
indicators and confidence
indicators and confidence
indicators and confidence
indicators and confidence

Martine joined the Wet Tropics Waterways team as a Science Technical Officer in early 2024. She is an environmental scientist and ecologist and has worked on water quality and aquatic ecology projects as a consultant and in private industry for over 20 years. She is using her experience in statistical programming and database development to develop new systems for the Report Card.

Richard has been the Science Technical Officer for Wet Tropics Waterways since 2016. His role involves producing the annual results for the waterway health assessment of the wet tropics region using data from a wide range of sources, to present as scores and grades, as well as developing new indicators to address knowledge and monitoring gaps. He works in collaboration with technical staff at other regional report cards.
Richard has a background in freshwater ecology research projects and environmental assessments with CSIRO, University of Queensland, Queensland Government and as a consultant. For a long time he’s been interested in freshwater aquaculture and continues this interest through farming freshwater crayfish, alongside other farming activities.

Simon has over 30 years’ experience advocating for waterways across academia, government and the private sector. He started out in marine botany with a fascination for seagrass, mangroves and macroalgae, and has gone on to lead major environmental initiatives both in Australia and overseas. He has established report cards in eight countries.
Rowan is a conservation scientist with a background in wildlife science and tropical ecology. She holds a Bachelor of Wildlife Science from the University of Queensland and has recently completed a Master of Tropical Biology and Conservation at James Cook University.
Rowan brings experience in science communication, with a strong interest in connecting people with conservation outcomes. In her role with Wet Tropics Waterways, she supports initiatives that combine scientific knowledge with community outreach to help protect the Wet Tropics and Great Barrier Reef catchments, and to strengthen collaboration between researchers, stakeholders, and the wider community.