The report card is a way for us to monitor and track the condition of our waterways over time. It is a tool that translates complex data and large amounts of information into easy-to-understand messages for our community and stakeholders.
The Wet Tropics Waterway Health Report Card was launched in 2016 and is a collaboration between community groups, Traditional Owners, farmers, fishers, industry, science, tourism, natural resource management groups and all levels of government, in recognition that we can achieve more by working together.
The report card’s Technical Working Group ensures indicators and scoring methods are based on the best available science, are locally relevant, reflect changes to waterway health, and where applicable are consistent with other report card programs across Queensland.
The report card integrates a range of Great Barrier Reef-wide and regional monitoring programs to measure waterway health in an environmental, social, economic and cultural context.
To arrive at report card indicators, priority aquatic ecosystem indicators that are suitable for measuring waterway health were selected based on regionally relevant values and pressures. Each indicator has a relevant benchmark (for example, a water quality guideline) that signals if it is in very good or very poor condition. Regional data for each indicator is compared to benchmarks using a specific methodology to produce a score. Scores correspond to one of five condition grades: Very Good (A), Good (B), Moderate (C), Poor (D), Very Poor (E). Scores for each indicator are rolled into categories and indices, and these scores are used to produce an overall score for an individual reporting zone in the region.
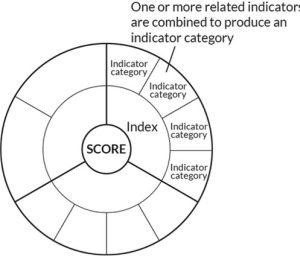
An indicator is the measured feature in the ecosystem (for example, particulate nitrogen). By combining one or more related indicator, we can produce an indicator category (for example, the ‘nutrients’ category is made up of particulate nitrogen and particulate phosphorus). Similarly, an index is generated by combining related indicator categories (for example, the ‘water quality’ index is made up of nutrients, water clarity, chlorophyll-a and pesticides). Lastly, the overall score is generated by combining indices (for example, water quality, coral, seagrass and fish indices can make up an inshore marine zone score).
Indicators, categories and indices are displayed in a ‘coaster’ to show which indicators are aggregated to produce category and index scores.
Annual reporting covers a full financial year stretching from July 1st of one year to June 30th of the next. This timeline for has been selected so that an entire wet season is included in one reporting period, which is often when the largest changes in water quality are detected.
Data must be collated from regional monitoring programs and validated, before comprehensive report card analysis and review. This process takes six to nine months, depending on the data type. Time is also needed to review the processes for collecting data, along with the data itself. This process is undertaken by both the Technical Working Group and the Reef Independent Science Panel.
At the indicator level, the amount of data (sample size) needed to obtain an indicator score is considered case-by-case by the data providers and the experts in the report card’s Technical Working Group. The indicator will not be scored if the sample size is considered inadequate.
To aggregate indicators into category and index scores, decision rules were developed for the minimum proportion of information required:
• ≥ 50% of measured indicators to generate the indicator category score (where relevant).
• ≥ 60% of indicator categories to generate an index score. *
Overall scores for reporting zones are presented in the report card, even if not all indices are available.
*Seagrass reporting incorporates two separate methods (each reporting two to three of their own specific indicators), which requires a separate decision rule for generating seagrass index scores. For more information, please refer to the method technical reports.
Every time an observation is made (data is collected) or a score is calculated, there is potential for error. Data confidence describes how confident managers and experts are in the methods of data collection and analysis used to produce an indicator score reported in the report card. Data confidence for the report card grades is measured on a five-point scale and tells us how confident we are, from very low to very high, that the calculated grade reflects the true condition of the indicator.
![]()
Results should be interpreted cautiously when confidence is not high (a score of three dots or lower). An example of this is water quality results in the freshwater river basins, which have a confidence score of three. This is because the overall score for basin water quality is derived from sites close to the end of the catchment on the major river of the basins. While the score is likely to represent this section of the basin’s waterways well, it will not represent the variation of conditions of waterways throughout the basin. For example, water quality in upper sections of a waterway with low levels of disturbance are likely to be better than sections close to the end of the catchment where the sample sites are located.
Grey areas indicate a data gap, which can be for several reasons. Data used for the report card must be collected and analysed in a scientifically robust manner. This could mean that data is available on a particular indicator, but work is still required to ensure that the indicator is reported in a suitable format for the report card. In other circumstances, there might be multiple programs collecting data, and additional analyses must be done to make sure that data between programs is consistent and comparable, as is the case for estuarine and marine fish across the region.
The Partnership is continuously improving the report card by filling data gaps and, ultimately, the grey areas on the report card. Recently this has included reporting on the freshwater fish community for basins, undertaking social surveys to quantify the human dimensions (social, cultural, economic values) of waterways, and the Urban Water Stewardship Framework—a way to assess how regional councils manage urban water across the Great Barrier Reef region compared to best practice guidelines.
A number of projects are underway to fill current data gaps or to expand on existing programs, including:
• Marine Fish: Reef fish is a critical knowledge gap in our reporting. Funded by the partnership between the Australian Government’s Reef Trust and the Great Barrier Reef Foundation, the Regional Report Card Partnerships are investigating the potential to incorporate existing marine fish citizen science programs into future report cards. We are also looking forward to the possibility of using data from the Reef Trust Partnership Integrated Monitoring and Reporting Program, now in development.
• Litter: We are currently working with our partner Tangaroa Blue to develop an indicator that uses citizen scientist-collected data to monitor litter in our waterways.
The Reef 2050 Water Quality Report Card addresses the entire Great Barrier Reef system and measures progress towards the goals and targets of the Reef 2050 Water Quality Improvement Plan (replacing the 2013 Reef Water Quality Protection Plan).
The Wet Tropics Waterways (WTW) Report Card is one of five regional report cards in Reef catchments that report on the health of our waterways and ecosystems at a local level. Being able to understand the health of local ecosystems alongside local community values enables management priorities and actions to occur at a regional scale.
The Paddock to Reef Integrated Monitoring, Modelling and Reporting Program (Paddock to Reef) is a collaboration between governments, industry bodies, regional natural resource management bodies, landholders and research organisations. The program started in 2009 and collects and integrates data on agricultural management practices, catchment indicators, catchment loads and the health of the Great Barrier Reef.
The Wet Tropics Waterways Report Card draws on data from the Paddock to Reef Program to report on seagrass, coral and water quality in our inshore marine zones, water quality in our catchments, and management practice of our sugarcane, grazing and horticulture industries.
Scores for the pesticide indicator are calculated using the Pesticide Risk Metric (see Technical documents for further information), which aims to quantify the ecological risk from exposure to a mixture of pesticides.
Below are the 22 pesticides that are measured in freshwater and estuary zones in the Wet Tropics report card. Pesticide data is collected as part of the great Barrier Reef Catchment Loads Monitoring Program run through the Queensland Government’s Department of Environment and Science.

Suspended sediment is particles of soil, sand and silt that are floating in the water column.
To test whether sediment levels in our basins are too high, we measure the amount of sediment in the water over the course of the year – especially during the wet season when we expect the most sediment to be ‘flushed’ from the surrounding land into our waterways. We then compare these sediment measurements to a ‘guideline’ for each waterway (what a healthy amount of sediment in the waterway should be) and assign a ‘grade’ based on whether or not the sediment we see in the waterway matches how much should be in the waterway.
Disturbance around or in our waterways can influence the amount of sediment in the water. Here are a few examples of sediment influences in our region:
• Human activities such as dredging and development can stir up sediment and cause erosion.
• Clearing of vegetation around waterways (i.e. riparian vegetation) can also greatly increase the amount of sediment washing into the water. This is because these plants usually trap large amounts of sediment before it can move into the waterway and be washed into the marine system.
• Animals, including cattle and feral pigs, can also contribute to erosion in regional waterways by feeding on riparian vegetation and physically eroding the landscape.
For inshore zones the Report Card uses two indicators of water clarity – total suspended solids (TSS), and turbidity.
These indicators evaluate water clarity and the amount of light that can reach the seafloor, which is essential to seagrass and coral growth. Light can be reduced in the water by three things: suspended sediments, chlorophyll (primary production) and coloured dissolved organic matter (CDOM). Turbidity measurements account for all three components, while TSS analysis accounts for only suspended sediment and chlorophyll.
The characteristics of suspended sediment can greatly influence turbidity measurements. For example, darker and finer-grained sediment will result in much higher turbidity readings than lighter-coloured and coarser sediments. These darker and finer-grained sediments are considered the most damaging to seagrass and coral growth (Bainbridge et al., 2018; Storlazzi et al., 2015).
As a result of these factors, turbidity is recommended as the ‘primary’ measure of water clarity, with TSS providing supporting evidence to clarify patterns.
Sediment is an issue for coral and seagrass in three major ways. Firstly, sediment enters the ocean floating in the water, similar to how dust floats through the air. If there are a lot of sediment particles floating in the water, they can block sunlight from reaching the coral on the seafloor. As coral and seagrass both need sunlight to produce energy, high sediment levels can greatly impact the growth and survival of these important species.
The second problem comes when sediment particles being carried in the water eventually drop out and settle on to the coral. If too much sediment lands on the coral and it is not washed off the coral in time, the coral may suffocate as it is unable to access enough oxygen or sunlight to produce energy.
Sediment may instead settle onto pieces of rock or old coral rubble. These are usually ideal places for new corals to attach to. If there is a large amount of sediment on these areas, this means that there is less free space for coral recruitment.
Chlorophyll is what creates the green colour in plant cells that allows them to make energy to grow. Chlorophyll-a is a particular type of chlorophyll. Specifically, the chlorophyll-a indicator measures the level of ‘microalgae’ (e.g. diatoms and phytoplankton) in the water.
Chlorophyll-a is a natural and essential part of all plants in our waterways. The issue with chlorophyll-a comes when the measured levels are higher than what is considered to be ‘normal’ for an ecosystem. Big increases in the amount of chlorophyll-a in the waterways are usually linked to higher levels of nutrients in the water. High levels of algal chlorophyll in the water can block sunlight from reaching aquatic plants (e.g. seagrass) and coral. At an extreme level, this creates what is known as an algal bloom, which can cause major issues for local aquatic plants and animals by reducing the amount of oxygen and light in the water and releasing toxic chemicals.
Offshore marine water quality scores were previously sourced from the Bureau of Meteorology (BOM) Marine Water Quality (MWQ) dashboard. In early 2021, BOM advised that the MWQ dashboard had been decommissioned and the underlying data would be discontinued during the year. Alternative data sources are being identified for reporting offshore water quality for the 2021–22 reporting period.